Analysis of % change in kelp grazed
Across three temperature treatments (9, 13, 16 C) and 2 predator treatments (with one live sunflower star or without)
Code
#pulling data from web ---------------------------------------------------------
kelp <- googlesheets4::read_sheet("https://docs.google.com/spreadsheets/d/1hYKwyw7xpImw0UkSa-QuuZrkBy2YU88_AIKomJshBQA/edit?gid=1832909041#gid=1832909041",
                                  "Kelp weight")

kelp_processed <- kelp %>%
  mutate(pcnt_grazed = ((Kelp_weight_before_g - Kelp_weight_after_g)/
                          Kelp_weight_before_g)*100)
Trials included in following graphs:
Code
#overview of kelp data
unique(subset(kelp_processed, !is.na(pcnt_grazed))$Trial)
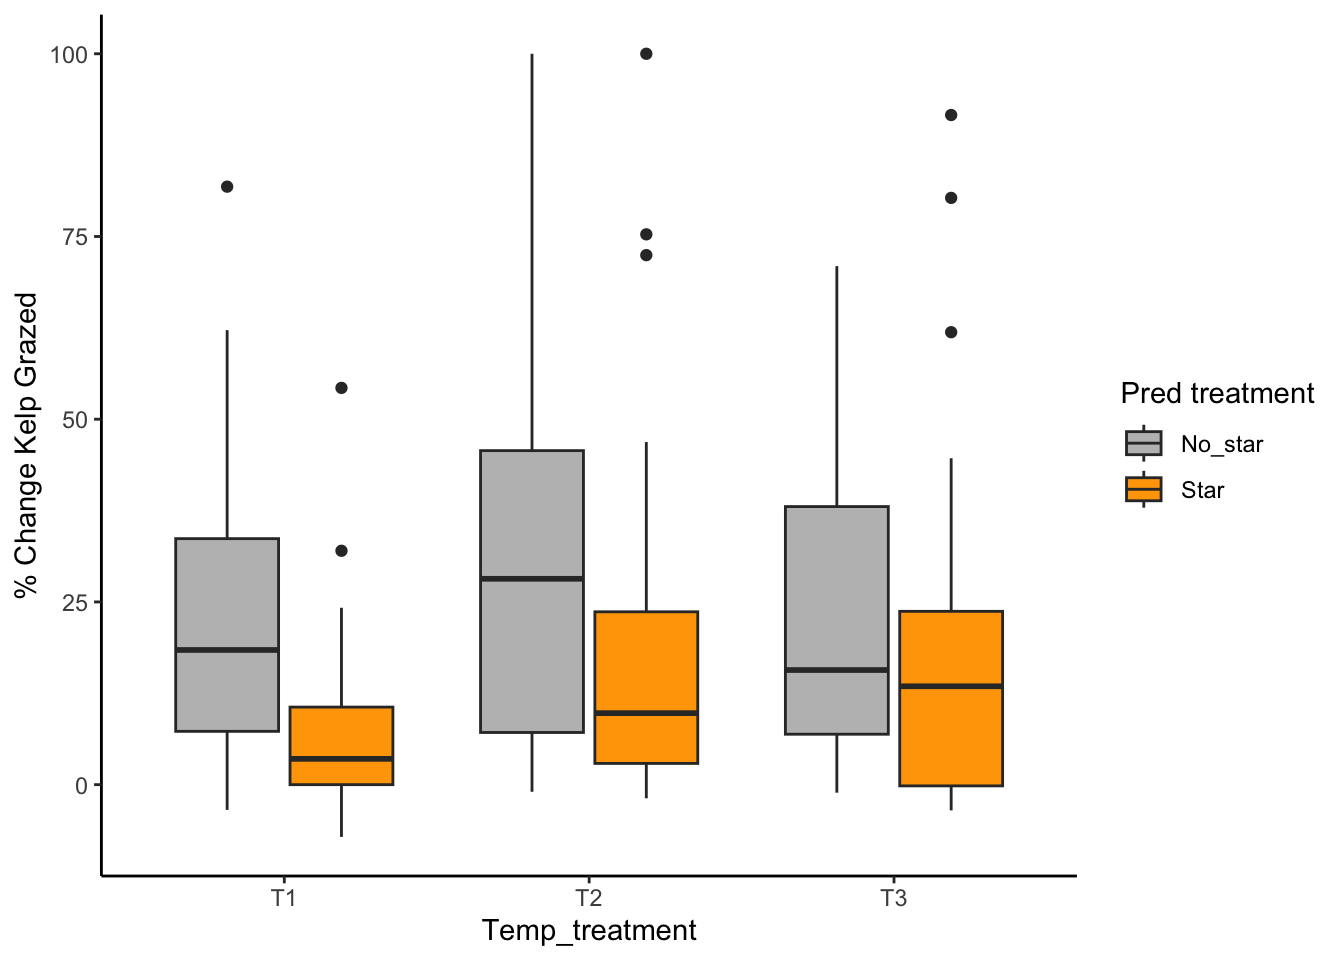
% Grazed over treatments
For all trials:
Code
#graph
ggplot(data = subset(kelp_processed, !is.na(pcnt_grazed)), aes(x = Temp_treatment, y = pcnt_grazed,
                                  fill = Pred_treatment) ) +
  geom_boxplot() +
  theme_classic() +
  scale_fill_manual(values = c('grey','orange') ) +
  ylab("% Change Kelp Grazed") +
  labs(fill = "Pred treatment")
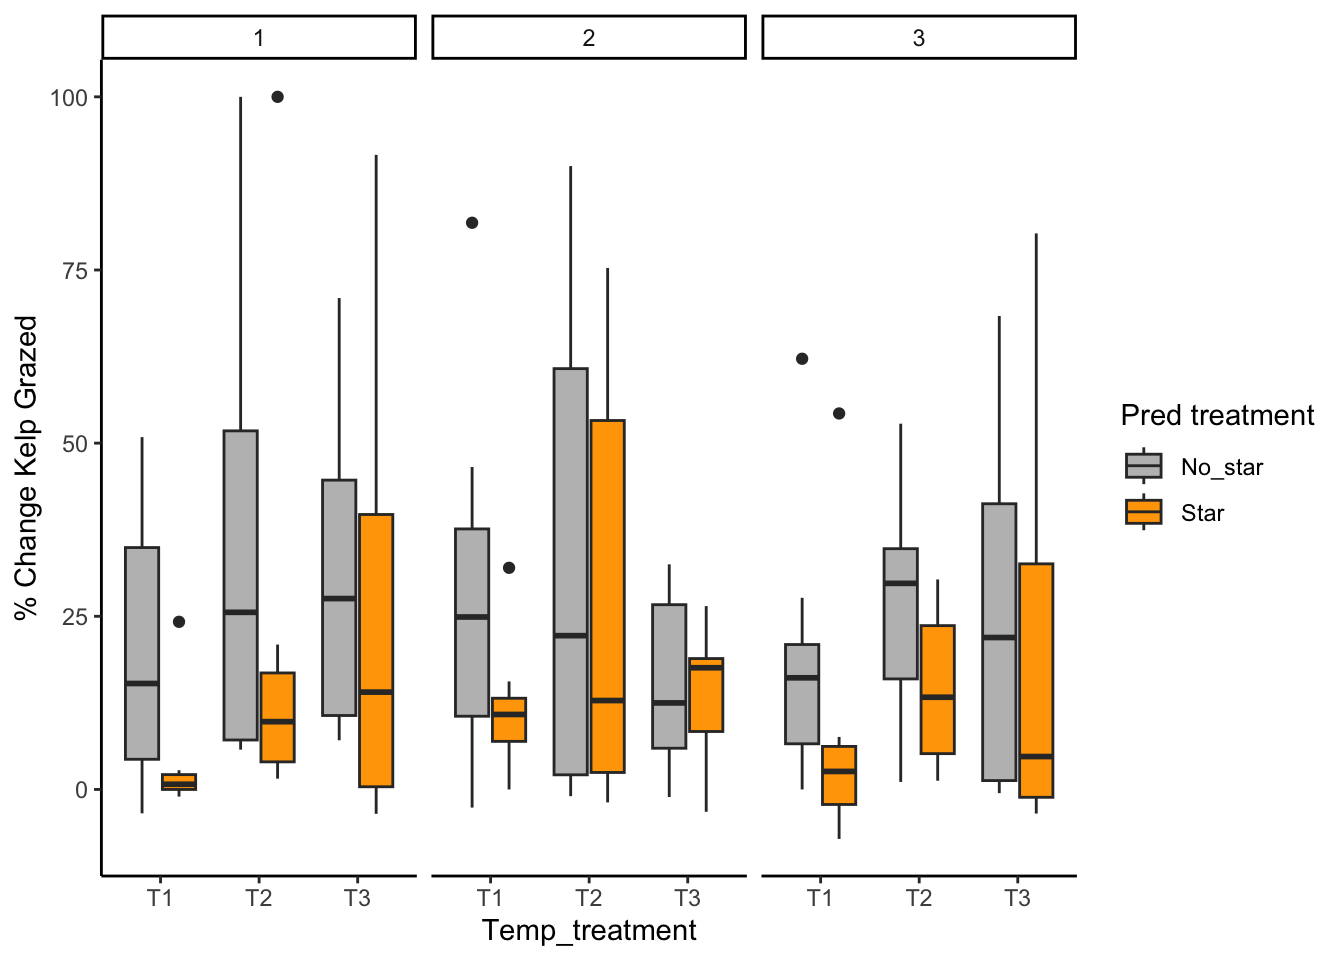
Per individual trial:
Code
#graph w facet wrap for trial
ggplot(data = subset(kelp_processed, !is.na(pcnt_grazed)), aes(x = Temp_treatment, y = pcnt_grazed,
                                  fill = Pred_treatment) ) +
  geom_boxplot() +
  theme_classic() +
  scale_fill_manual(values = c('grey','orange') ) +
  ylab("% Change Kelp Grazed") +
  labs(fill = "Pred treatment") +
  facet_wrap(~ Trial)