PycnoPie

Published

August 26, 2024

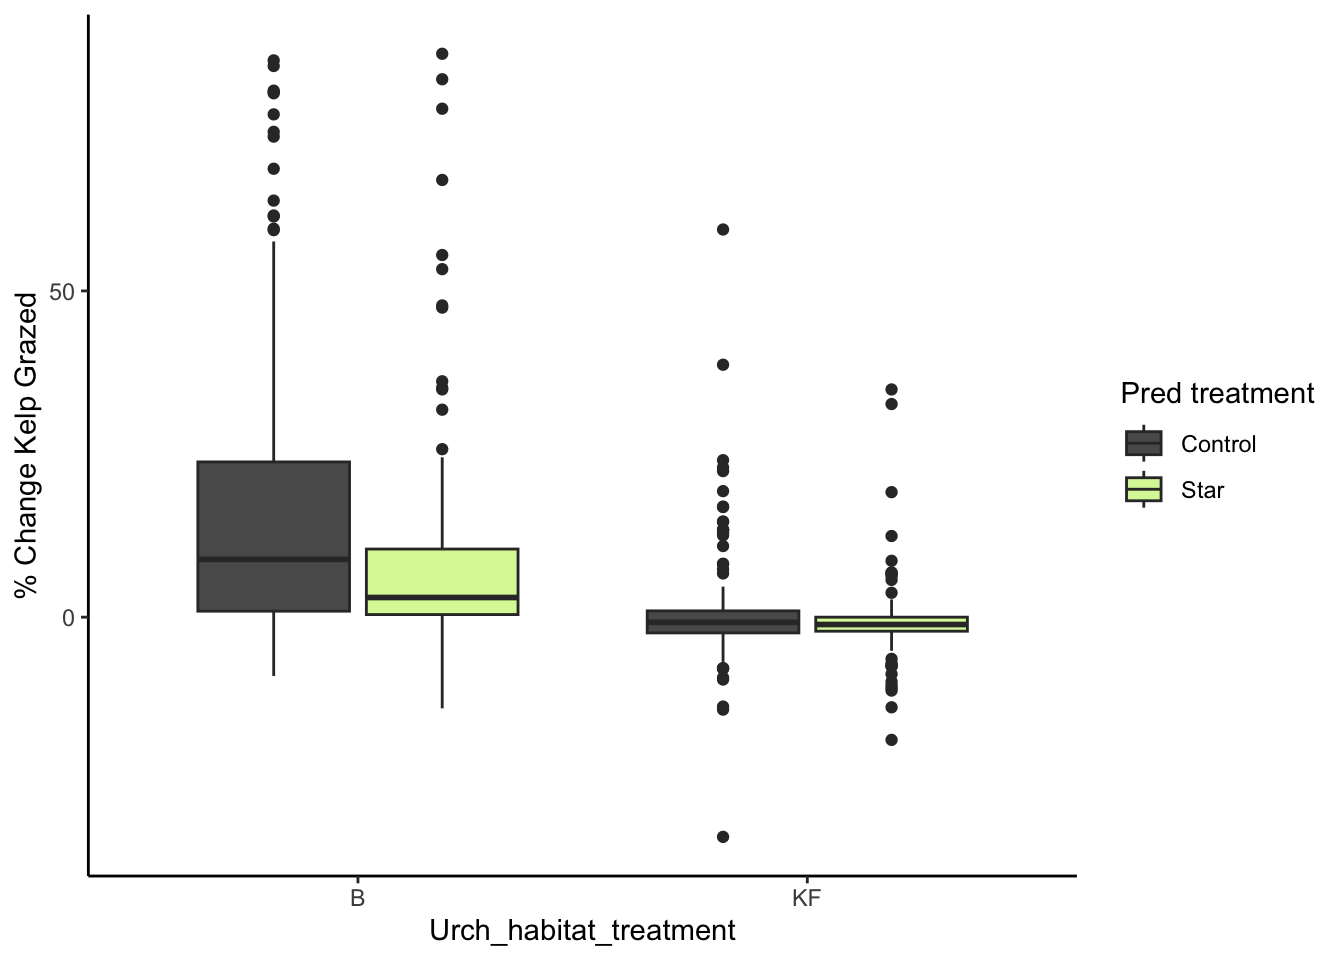
An analysis of the percentage change in kelp consumed across urchin source habitats (urchin barren or kelp forest) and predator treatments (seastar present/ no seastar present)

Code
#pulling data from web ---------------------------------------------------------
kelp <- googlesheets4::read_sheet("https://docs.google.com/spreadsheets/d/1yFkZm64m7c9b4EdSxK3-qR8B7I-5rWyk7CDs7fmmMKg/edit?gid=184409314#gid=184409314",
                          "Kelp") 

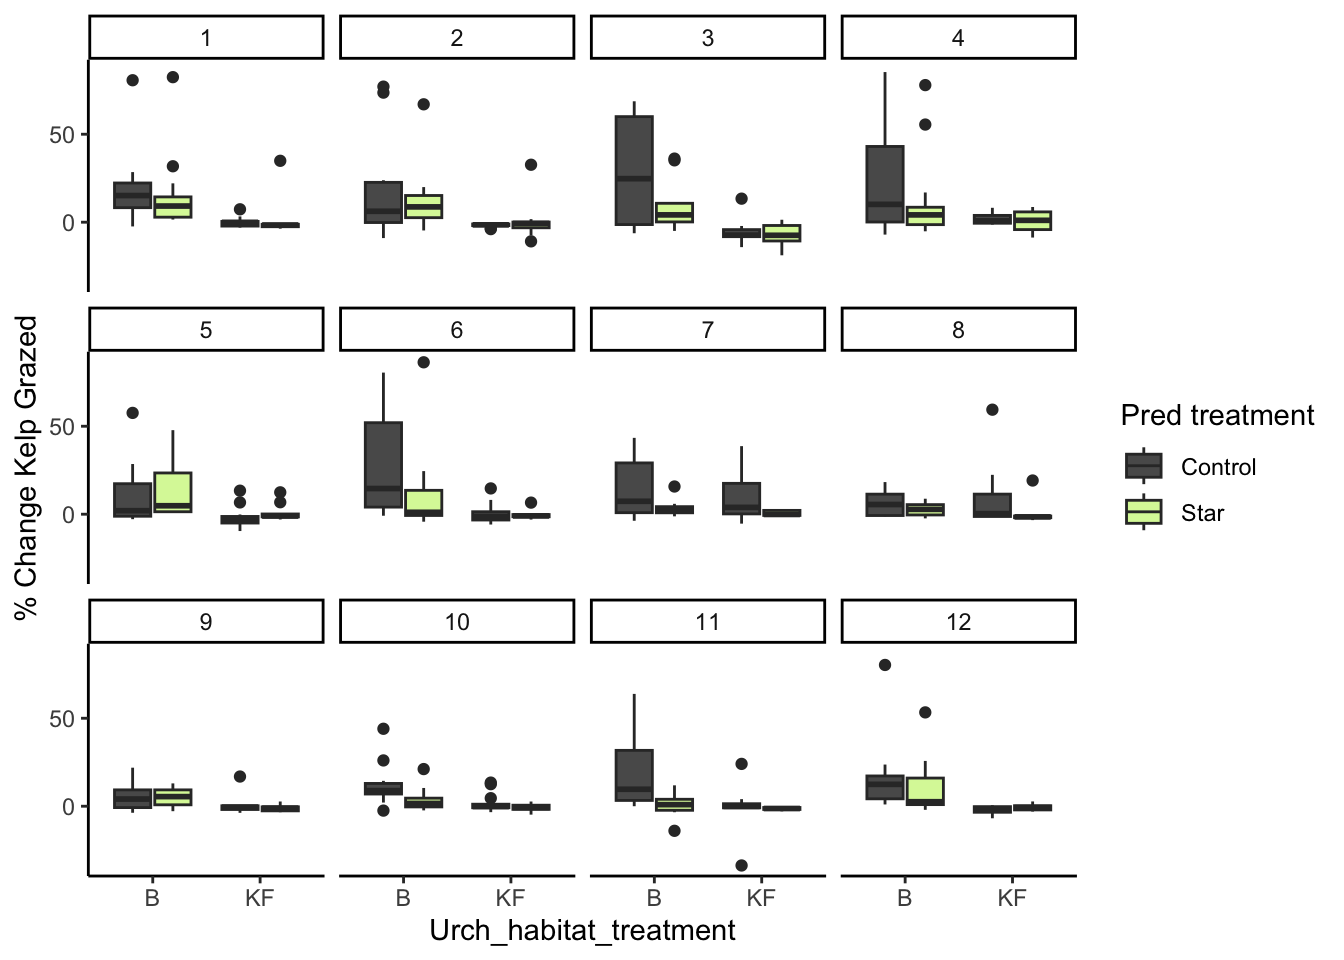
Trials included in following graphs:

Code
#overview of kelp data
unique(subset(kelp_processed, !is.na(pcnt_grazed))$Trial)
 [1]  1  2  3  4  5  6  7  8  9 10 11 12

Urchin source habitat vs. kelp grazed for different predator treatments

Boxplot for all trials:

Code
#graph 
ggplot(data = subset(kelp_processed, !is.na(pcnt_grazed)), aes(x = Urch_habitat_treatment, y = pcnt_grazed, 
                                  fill = Pred_treatment) ) +
  geom_boxplot() +
  theme_classic() +
  scale_fill_manual(values = c('#5A5A5A','#DAF7A6') ) +
  ylab("% Change Kelp Grazed") +
  labs(fill = "Pred treatment")

Boxplot for Individual trials:

Code
#graph w facet wrap for trial
ggplot(data = subset(kelp_processed, !is.na(pcnt_grazed)), aes(x = Urch_habitat_treatment, y = pcnt_grazed, 
                                  fill = Pred_treatment) ) +
  geom_boxplot() +
  theme_classic() +
  scale_fill_manual(values = c('#5A5A5A','#DAF7A6') ) +
  ylab("% Change Kelp Grazed") +
  labs(fill = "Pred treatment") + 
  facet_wrap(~ Trial)